Power BI is a great tool to turn out reports from many data sources. With OLE DB connector added in the October Update of Power BI it is quite easy to generate a report.
In this post I describe creating a report using data from the Financial Data (Group 0) of the sample database 'demo'
Step 1:
Connect to SQL Anywhere 17
Launch SQL Central and connect to Demo database
Step 2:
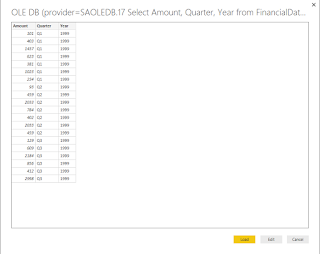
Launch PowerBI and connect to SQL Anywhere 17 Demo database using a OLE DB connection. Make sure to use the Advanced button to run the query as shown.

SQLAny17_Repo_00.png
When you get the data in the Query Editor click Load.
SQLAny17_Repo_01.png
The Financial Data gets loaded as shown.

SQLAny17_Repo_02.png
Choose data fields as shown:

SQLAny17_Repo_03.png
Choose the visualization as shown.

SQLAny17_Repo_04.png
Drag Amount to Tooltips as shown.

SQLAny17_Repo_05.png
Now when you hover over the graph you get to see the tool tip. The repeated data is because Amount is both in Value and Tooltips fields.

SQLAny17_Repo_06.png
In this post I describe creating a report using data from the Financial Data (Group 0) of the sample database 'demo'
Step 1:
Connect to SQL Anywhere 17
Launch SQL Central and connect to Demo database
Step 2:
Launch PowerBI and connect to SQL Anywhere 17 Demo database using a OLE DB connection. Make sure to use the Advanced button to run the query as shown.

SQLAny17_Repo_00.png
When you get the data in the Query Editor click Load.

SQLAny17_Repo_01.png
The Financial Data gets loaded as shown.

SQLAny17_Repo_02.png
Choose data fields as shown:

SQLAny17_Repo_03.png
Choose the visualization as shown.

SQLAny17_Repo_04.png
Drag Amount to Tooltips as shown.

SQLAny17_Repo_05.png
Now when you hover over the graph you get to see the tool tip. The repeated data is because Amount is both in Value and Tooltips fields.

SQLAny17_Repo_06.png


No comments:
Post a Comment