This post provides a tutorial approach to authoring a report with Microsoft PowerBI using data on a SQL Server 2012.
PowerBI is Microsoft's preview software that you can download for free if you are in USA. Probably it will be available to users in other countries as well. It is the latest iteration to provide a toll to the
non-programmer type who desires to create Ad-hoc reports easily without knowing too much of the innards of the data source but knowing all about their business.
Read here for more information:
http://hodentek.blogspot.com/2015/02/power-bi-unchained.html
Before you start authoring the report make sure your SQL Server is running and that you have downloaded and installed the PowerBI software from this location: http://www.powerbi.com/
The installation is very simple and takes only 4 interactive screens.
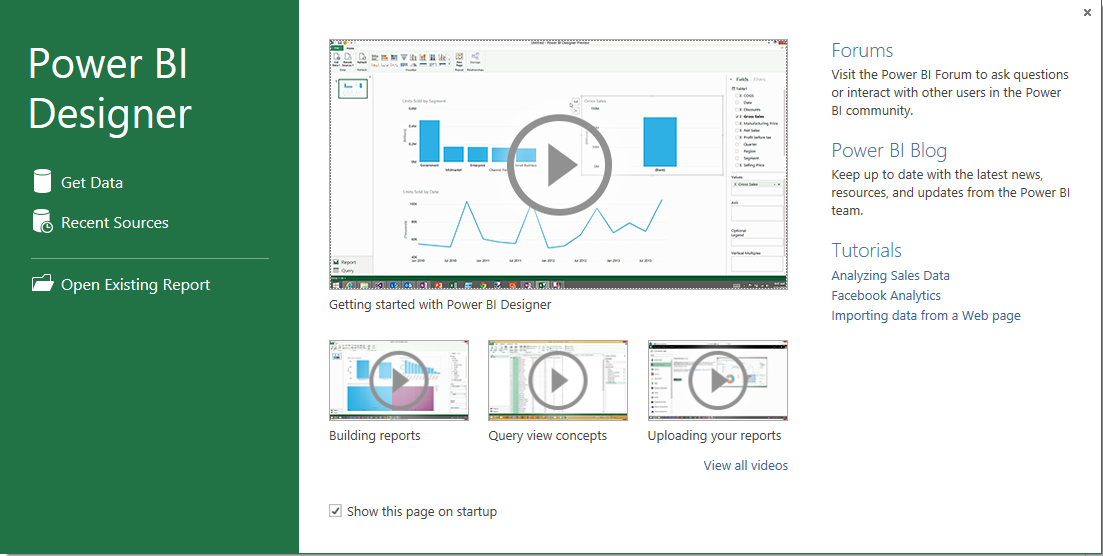
After the download PowerBI gets launched.

PowerBI08.png
On the left you have a navigation pane. You can click on the link and get to the task you want to accomplish. In the right hand pane you have a video you can watch to get started and a few other videos. You also have access to the forums; the PowerBi blog and several tutorials. You may
also opt out to not show this page in subsequent launches,
Click on Get Data. The Get Data page gets displayed as shown.
PowerBI09.png
Notice that you can also access data on your Azure as well as quite a large selection of data sources. The picture shows only half the resources. Scroll down and review the rest.
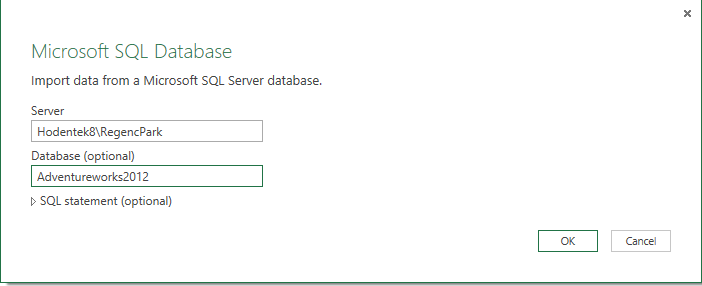
In this post, you will be connecting to an instance of SQL Server 2012 that contains a AdventureWorks2012 database.
Click SQL Server Database in the above image. You will be displayed a page with ttle Microsoft SQL Database and you will be importing data from a Microsoft SQL Server Database. As I mentioned earlier I will be getting data from an instance of SQL Server called RegencyPark. I will have to give the complete reference to this instance. Since my laptop is named Hodentek8, the complete refeerence is Hodentek8\RegencyPark and the name of the database I will be using.
PowerBI10.png
Click OK. You get the 'Access a Microsoft SQL Database' page displayed.
PowerBI11.png
Herein you need to provide authentication information. Windows authentication was used during installation and so just click Connect at the bottom of the screen.
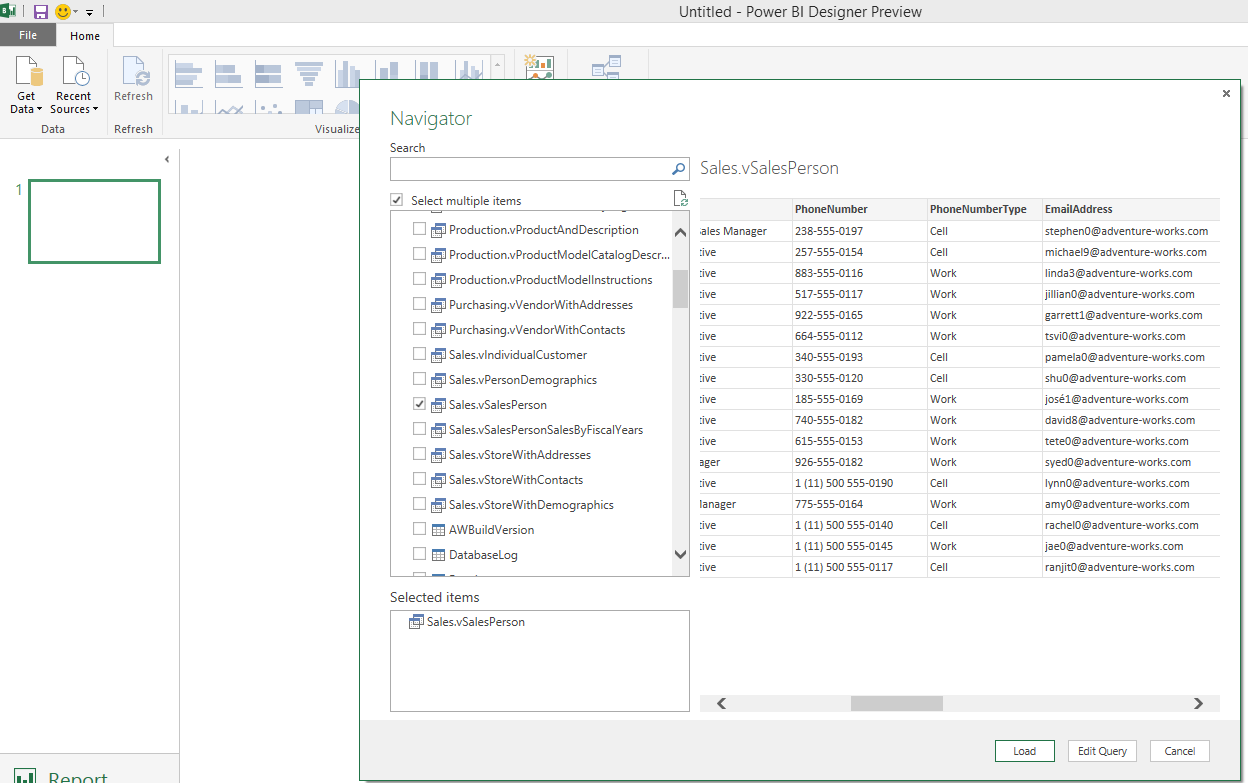
You will be displayed the Navigator pane showing all the tables in your
database as shown.
PowerBI12.png
Clicking on any of the tables you can see the details for that table in the Preview is Blank area as shown. If you remember a table name you can also search.
PowerBI13.png
You can select multiple tables to create a report. Here to keep it simple I have chosen the Sales.vSalesperson table and you can see a blank report shown as a rectangle bordered green.

PowerBI14.png
The designer has the typical Office look with Menu and toolbar menu. You can also see various charts design templates for data visualization.
Click Load. You may also use the GetData and Recent Resources links to get
the data.
Hidden behind the image on the top of the above screen you will also find Fields pane at extreme right. It lists out all the columns in the Sales.SalesPerson table. Use the scroll-bar to see more of the fields.
In the fields pane I choose Last Name, SalesLastYear, SalesQuota and
Sales YTD and voila the report is generated. I could choose to create the type chart I like by choosing in the menu bar.
PowerBI16.png
I can immediately create another report (a new one) by choosing other different fields (TeritoryName, SalesYTD and SalesLastYear) as shown here. I need not get out of the designer and the first report also exists to which you can switch into by clicking on it. This is very much like Power View introduced in SQL Server Reporting Services 2012.
A summary veriosn was presented here:
http://hodentek.blogspot.com/2015/02/spin-out-cutting-edge-report-with-power.html
PowerBI is Microsoft's preview software that you can download for free if you are in USA. Probably it will be available to users in other countries as well. It is the latest iteration to provide a toll to the
non-programmer type who desires to create Ad-hoc reports easily without knowing too much of the innards of the data source but knowing all about their business.
Read here for more information:
http://hodentek.blogspot.com/2015/02/power-bi-unchained.html
Before you start authoring the report make sure your SQL Server is running and that you have downloaded and installed the PowerBI software from this location: http://www.powerbi.com/
The installation is very simple and takes only 4 interactive screens.
After the download PowerBI gets launched.

PowerBI08.png
On the left you have a navigation pane. You can click on the link and get to the task you want to accomplish. In the right hand pane you have a video you can watch to get started and a few other videos. You also have access to the forums; the PowerBi blog and several tutorials. You may
also opt out to not show this page in subsequent launches,
Click on Get Data. The Get Data page gets displayed as shown.
PowerBI09.png
Notice that you can also access data on your Azure as well as quite a large selection of data sources. The picture shows only half the resources. Scroll down and review the rest.
In this post, you will be connecting to an instance of SQL Server 2012 that contains a AdventureWorks2012 database.
Click SQL Server Database in the above image. You will be displayed a page with ttle Microsoft SQL Database and you will be importing data from a Microsoft SQL Server Database. As I mentioned earlier I will be getting data from an instance of SQL Server called RegencyPark. I will have to give the complete reference to this instance. Since my laptop is named Hodentek8, the complete refeerence is Hodentek8\RegencyPark and the name of the database I will be using.
PowerBI10.png
Click OK. You get the 'Access a Microsoft SQL Database' page displayed.
PowerBI11.png
Herein you need to provide authentication information. Windows authentication was used during installation and so just click Connect at the bottom of the screen.
You will be displayed the Navigator pane showing all the tables in your
database as shown.
PowerBI12.png
Clicking on any of the tables you can see the details for that table in the Preview is Blank area as shown. If you remember a table name you can also search.
PowerBI13.png
You can select multiple tables to create a report. Here to keep it simple I have chosen the Sales.vSalesperson table and you can see a blank report shown as a rectangle bordered green.

PowerBI14.png
The designer has the typical Office look with Menu and toolbar menu. You can also see various charts design templates for data visualization.
Click Load. You may also use the GetData and Recent Resources links to get
the data.
Hidden behind the image on the top of the above screen you will also find Fields pane at extreme right. It lists out all the columns in the Sales.SalesPerson table. Use the scroll-bar to see more of the fields.
In the fields pane I choose Last Name, SalesLastYear, SalesQuota and
Sales YTD and voila the report is generated. I could choose to create the type chart I like by choosing in the menu bar.
PowerBI16.png
I can immediately create another report (a new one) by choosing other different fields (TeritoryName, SalesYTD and SalesLastYear) as shown here. I need not get out of the designer and the first report also exists to which you can switch into by clicking on it. This is very much like Power View introduced in SQL Server Reporting Services 2012.
PowerBI18.png
That's all. No calculating X-axis, Y-axis etc. The type of tasks you do with Excel. This is as simple as it can get. I took a whole page to describe and I bet you can do it in 10 minutes.A summary veriosn was presented here:
http://hodentek.blogspot.com/2015/02/spin-out-cutting-edge-report-with-power.html


Microsoft has actively sustained what they call “a blistering pace of innovation” and, whilst
ReplyDeletelistening to user needs, they continue to update Power BI with monthly updates. Accessible to everyone,
and with over 90 000 organizations using it, Power BI is growing at
such a pace that it is, in itself, a game changer. Data Bear founder, Johann Joubert, says, “For any business
that is serious about gaining valuable insights and being a part of the future of self-service BI, the niche
of business intelligence consulting focused on transitioning them to Power BI is a valuable partnership.”
Contact companies like Data Bear to find out more about how Power BI can
empower your business to be at the forefront of the rapidly changing BI game. For more info, visit www.databear.com.
I'm trying to create a connection to a Sybase database type , using the advantage database server , how can I make that connection ??
ReplyDeleteI think you need to take care of a large part of Power BI and its vivacious use.
ReplyDeletepowerbi read rest
https://saurav-nav.blogspot.com/2015/09/microsoft-power-bi-introdcution.html
ReplyDeleteGreat! I like to share it with all my friends and hope they will also like this information.
ReplyDeletePower Bi Training In Hyderabad
Power Bi Online Training
Very useful blog for beginners who look opportunity in Power BI. If you are looking for Real-Time Power BI Training in Bangalore Contact Boyina Soft for demo class.
ReplyDeleteSuch a useful blog...Thanks for sharing the information...
ReplyDeletepower bi training in bangalore
Excellent Information...Thank you...
ReplyDeleteqlikview training in bangalore
Truly, this article is really one of the very best in the history of articles. I am a antique ’Article’ collector and I sometimes read some new articles if I find them interesting. And I found this one pretty fascinating and it should go into my collection. Very good work!
ReplyDeleteSalesforce Training in Chennai
Salesforce Online Training in Chennai
Salesforce Training in Bangalore
Salesforce Training in Hyderabad
Salesforce training in ameerpet
Salesforce Training in Pune
Salesforce Online Training
Salesforce Training
Very nice article,Thank you...
ReplyDeletePower BI Learn Online
Well Said, you have furnished the right information that will be useful to anyone at all time. Thanks for sharing your Ideas.
ReplyDeletePower Bi training in bangalore
Power Bi institutes in bangalore
Great Article!
ReplyDeleteGet in touch with a Microsoft Power BI Partnerto know more about the solution and its integration.
Nice post, thanks for sharing...!!
ReplyDeleteA certified Power BI professional is required by most of the organizations, nowadays and this has increased the demand for such professionals. MindCypress is the one stop solution for Power BI Certification
and training. We offer a full course on Power BI that explains how to automate data and convert them into useful insights by using the right techniques.
Thank you for sharing wonderful information with us to get some idea about that content.
ReplyDeletePower BI Online Training Hyderabad
Power BI Online Training India
Thank you for sharing wonderful information with us to get some idea about that content.
ReplyDeletepower bi training in ameerpet
power bi training in course
ReplyDeleteThanks to blog author for wonderful and informative post,
Very useful blog for beginners who look opportunity in Power BI.
very nice informative content.
Visit:Best power bi training institute in Hyderabad
Power BI is an interactive data visualization software product developed by Microsoft with a primary focus on business intelligence. It is part of the Microsoft Power Platform.
ReplyDeleteThis comment has been removed by the author.
ReplyDeleteThis comment has been removed by the author.
ReplyDeleteThe article is informative. Can you also share more articles on the role of data analytics in industries.
ReplyDeleteThank you for sharing Article
ReplyDeletejava fullstack training in hyderabad
https://salesandrecruiting.blogspot.com/2021/02/microsoft-power-bi-developer-wa.html?sc=1686734376809#c2731807495504129261
ReplyDeleteYour tutorial on using Power BI to create reports with SQL Server 2012 data is incredibly informative and well-structured. The step-by-step approach you've taken, along with the accompanying screenshots, makes it easy to understand and follow the process. It's impressive how Power BI streamlines the report creation process for non-programmers, and your explanation truly highlights its user-friendly nature. By the way, could you also explain what is BI developer and their role in this context? Thanks for sharing this valuable guide!
ReplyDelete"This is the kind of content that makes the internet a better place."
ReplyDeleteour sclinbio.com
This comment has been removed by the author.
ReplyDeleteHi dear, This is an nice and valuable post thanks for this information
ReplyDeletepython full stack training in Hyderabad
This article on Power BI is highly informative and well-written. It effectively highlights the platform's robust features and practical applications, making it clear why Power BI is a valuable tool for data analysis and visualization. The detailed explanations and real-world examples make the article both engaging and educational. Great job!
ReplyDeletePower BI Course
A granite headstone is a popular choice for memorializing loved ones due to its durability, elegance, and timeless appeal. Granite is highly resistant to weathering, making it an excellent material for headstones that need to withstand the elements for many years. granite tombstone
ReplyDeleteGreat blog and very informative content!
ReplyDeleteWe appreciate you sharing valuable insights on this topic.
Thanks again for the detailed post — looking forward to more such content!
SAP MM Online Training
SAP MM Online Training
This article’s strength lies in its clarity. The content is broken into sections that make sense, and nothing is overly technical or confusing.
ReplyDelete< a href ="https://generativeaimasters.in/">Generative AI Training In Hyderabad
Thanks for sharing this very good write-up. Very interesting ideas! (as always)
ReplyDeleteInformatica Training Classes
Data Analytics Online Course from Malaysia
Microsoft Office Training from Hyderabad
Python Online Classes
Certified AWS SysOps Administrator Training
SCOM 2019 Online Coaching from Canada
SAP Fiori Security Online Training
Nice Article!
ReplyDeleteThanks for sharing with us 🙂
Cost of Vaginoplasty
Nice Article!
ReplyDeleteThanks for sharing with us 🙂
SAT Coaching in Hyderabad
ReplyDelete“Good job! I like how you included visuals/examples in the article.”
ISTQB CERTIFICATION TRAINING IN HYDERABAD
Thanks for sharing this very good write-up. Very interesting ideas! (as always)
ReplyDeleteIBM MQ Administration Online Training from India
Project Management Professional(PMP) Online Live Classes
Oracle Data Integrator 11g / 12c Training
Microsoft Power Automate Online Training
Oracle Fusion PPM Certification Online Training from Hyderabad
OAM Self paced Training Videos
Talend Online Live Classes
SQL Server Analysis Services(SSAS) Online Training from India
Informatica Master Data Management Training
Oracle Fusion Applications Online Training Institute from India, Hyderabad
Best Data Science Online Certification Training India
ReplyDeleteVmware Realtime Online Support In India
Data Modelling Free Live Online Demo Class
SAP Commerce Cloud Interview Questions & Answers
Oracle RAC DBA Online Live Classes
SCCM Self paced Training Videos
SAP BW On Hana Online Training from Hyderabad
Selenium with Python Online Training from India
SAP QM Certification Training
Integrating Power BI with SQL Server 2012 is a smart way to transform raw data into meaningful insights and interactive reports. Data-driven decision-making is not just crucial in business analytics but also in healthcare. At Vedanta Hospitals, a leading Cardiothoracic Surgery Hospital in Kadapa, we utilize advanced medical data systems to monitor patient progress and improve treatment outcomes. Just like Power BI streamlines reporting, technology in healthcare helps us deliver precise and informed patient care.
ReplyDeleteGreat post on Hodentekmsss! The insights shared here are clear, informative, and very helpful for readers looking to understand the topic better. Keep up the excellent work and continue sharing such valuable content.
ReplyDeleteAn Abacus Trainer plays a key role in developing children’s mental arithmetic, concentration, and problem-solving skills through structured methods. By offering the best abacus online classes, trainers make learning interactive and accessible from anywhere, helping students build strong numerical foundations at an early age. Along with abacus training online, many trainers also integrate Vedic maths classes online to enhance speed, accuracy, and confidence in calculations, making math learning fun, effective, and future-ready.
abacus classes online
Great post on Hodentekmsss! The insights shared here are clear, informative, and very helpful for readers looking to understand the topic better. Keep up the excellent work and continue sharing such valuable content.
ReplyDeleteDiscover Unique Champs Chess Foundation’s story, mission & vision. Top chess academy in India & Hyderabad offering online coaching and free classes.
chess academy in hyderabad
Great post on Hodentekmsss! The insights shared here are clear, informative, and very helpful for readers looking to understand the topic better. Keep up the excellent work and continue sharing such valuable content.
ReplyDeleteJoin A3 Schools – India’s best online classes for students. Live online courses in coding for kids, abacus, robotics, arts, music, languages & more.
online classes for students
Very helpful guide on authoring Power BI reports with Excel
ReplyDeleteThe steps are clear and easy to follow, even for beginners.
Thanks for sharing such practical and useful insights
best e sim uk
Hodentekmsss is an informative blog that shares useful insights on technology, digital trends, and practical tips for learners and professionals. The content is well-structured and easy to understand, making it a great platform for staying updated with the latest tech topics.
ReplyDeleteStart your journey with a trusted franchise of abacus and vedic maths franchise. Explore opportunities for a successful abacus franchise today.
abacus Franchise in india
This makes it easier to understand how to build a report using Power BI DesktopStudent Sim
ReplyDeleteGood explanation of connecting data and creating visuals in Power BIeSim data plans Usa
ReplyDeleteHelpful for beginners learning how to author reports step by stepCanada prepaid eSIM data
ReplyDeleteNice overview of the report creation process with clear instructionsglobal eSIM partner
ReplyDeleteThanks for sharing this guide, it explains the basics in a simple way.ZetSIM affiliate commission
ReplyDeleteExcellent Information...Thank you...
ReplyDeleteBest Non-Surgical Hair Replacement in Hyderabad
Great step-by-step explanation of creating a Power BI report using SQL Server data. Simple walkthrough that makes report authoring easy for beginners.lightweight festive lehenga
ReplyDeleteI think you need to take care of a large part of Power BI and its vivacious use.
ReplyDeleteHair Extension in Hyderabad