Tuesday, July 31, 2018

Using SQL Operations Studio

In order to use a program, it is first of all necessary to have a clear understanding of the User Interface for screen driven application.

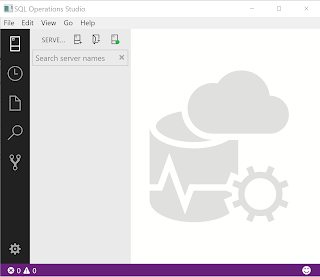
SQLOPS when invoked brings up the user interface screen. It is here you do most of your development.

As mentioned in previous posts this is a light-weight tool. It provides a much easier interface then the SQL Server Management Studio, a heavy-weight option.

You invoke the program by double clicking the sqlops.exe in the folder where you saved the application files.

The following window is displayed:


The following icon joins the taskbar in Windows 10.


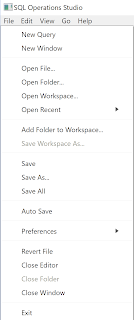
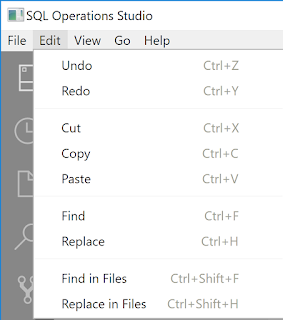
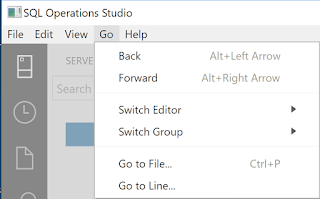
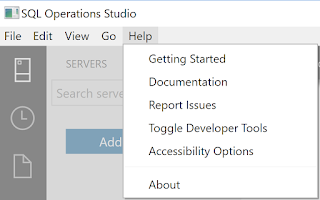
The UI is simple and the main menu items opens the following sub-menus.
The File menu item has the query related and has access to folder/file sysyem


 The Edit meu item is like any other Microsoft application (Word, Excel, ...)


The View menu item has many more important items such as Servers, Explorer,


The Help menu is important as it is here you get he main documentation as well as initial knowledge for you to start using it.


The icons in the panel on the left gives access to the tasks and the keyboard key shortcuts.


I think even non-DBA types can use this interface. It is cool!!

Enabling Machine Learning in SQL Server - 1

The important question is whether Machine Learning (ML) is enabled or not.

You can find if ML is enabled or not by the following:


Launch SQL Server, the version for which you want to use and start a New Query. Run the following in the context of the server:


sp_configure 'external scripts enabled'

Depending on the response to this query, you can find whether Machine Learning is installed or not. If the run_value=0, ML is not enabled.

MachineLearning_0
However the following query gives more information.


MachineLearning_1
You need to install 'Advanced Analytics Extensions' to enable Machine Learning (Using R or Python)

Monday, July 30, 2018

Add a SLICER and filter your data to Visualize

SLICER control provides filtering capability to the report, both Basic and Advanced.

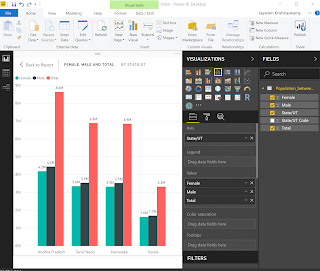
Here is a clustered column chart from one of my previous posts.
The data of Male/Female/Total populations for several states in India is shown.


This uses a Clustered Column chart shown.


The next image shows the data behind the above report.


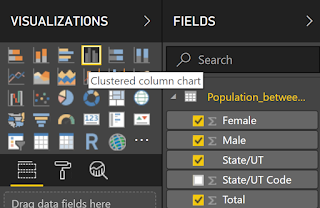
Only very few of the Indian States haven been chosen for the report and if you had had all of the States in this view it will be more crowded. Now how do I just filter a State from this report. You can do this by adding a SLICER (shown in the next image and you find thiss under VISUALIZATIONS).


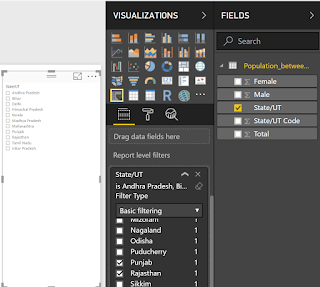
You click and add the SLICER. The SLICER gets added to the report as shown. Here is a List of all STATES in the report. Instead of a List , you could also opt for a Drop-down list.


Now using the Basic filtering you can manipulate the report to show the one for the STATE you choose in the LIST as shown (Herein PUNJAB is chosen).


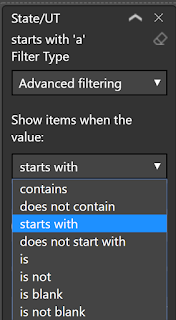
In addition to Basic you also have Advanced filtering where you can impose further conditions on your choice for the states.

Using the condition that the STATE name starts with 'C', the number of States is reduced. Now you can choose from this reduced LIST.


Sunday, July 29, 2018

Creating Combo charts in Power BI

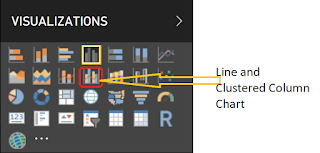
Combo charts or charts of type in VISUALIZATIONS which share the same x-Axis.  First of all you need to choose the type of chart that you want to create.

Here is a clustered column chart from one of my previous posts.


ComboChart_0

This shows a chart of male, female and total populations in four of Indian States, Andhra Pradesh, Tamil Nadu, Karnataka and Kerala (all South Indian states).

Now I change this chart type to Line and Clustered Column Chart. The chart will not change.


ComboChart_1

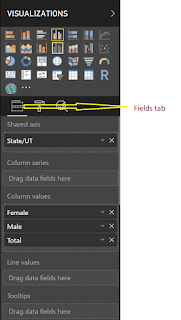
Now go back to the Fields tab under VISUALIZATIONS as shown here.


ComboChart_2

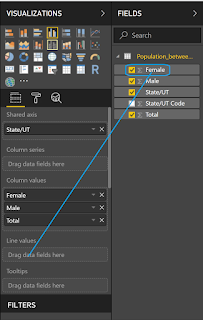
Now drag one of the fields (Female in this case) under FIELDS to the space under Line Values under the VISUALIZATIONS|Fields as indicated in the next image.

ComboChart_3

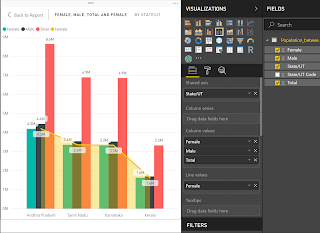
Now the Chart appears as shown, you see the Line chart superimposed on the Column chart.


ComboChart_4

Now go back to Format under VISUALIZATIONS and expand Shapes as shown here.


ComboChart_5

Here, you can turn-off the shaded area under the line graph. You can choose several other visual items a shown here.


ComboChart_6

You can also have a combo chart using the Line and Stacked Column chart as shown here:


ComboChart_7


Saturday, July 28, 2018

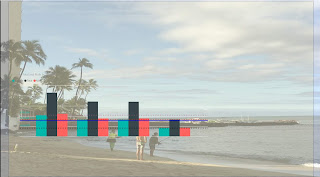
Wall papering a report using Power BI July update

This adds a cool effect to a report instead of a drab looking, dry report. Wall Paper background make look it cool.

I had an old report that I loaded to the July 2018 Update of Power BI. What I call a drab looking report is shown is here.

It is OK but not cool.

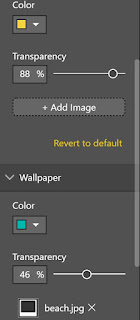
The way you apply a Wall Paper to this report uses the Page related controls. Transparency of the Page and the Wall Paper (its transparency, Color and Image choice).


In the Wallpaper section you can import an image, set its background color and set its transparency. These choices were made of the Page  (the drab page earlier) and the image was chosen from the available ones on the computer by browsing).

If you do not set the transparency of the page, you will see very little of the wall paper, but choosing the correct you can see the transparency well. The exact settings is to your taste.


The choices made for the above are shown in the settings below.


You can also adjust the size of the Wall Paper and here it is set to 'Fit'


Get the July 23, 2018 Power BI and test drive

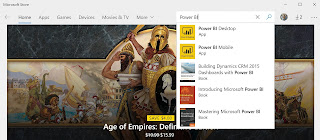
You can download Power BI Desktop from link shown at the end , or get it from Microsoft Store (Search for Power BI in Windows Store).


Power BI is Microsoft's Business Intelligence software that allows you turn out eye-catching reports from a variety of data sources offering superb visualization. What is more? It is updated every month to bring in new functionalities; improve existing ones and offering new data connectivity options.

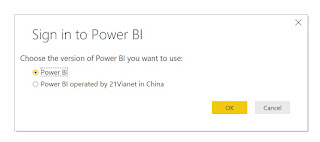
I downloaded from Windows store and it looks like there are two versions of Power BI. I chose the first option.


The full name of the product I installed is the following:


These are the new features of the July 2018  (2.60.5169.3201)
update:


Modeling
Composite models (preview)

Reporting
New visual header with more flexibility and formatting
Wallpaper formatting
Theming update – more visual and page control (preview)
Tooltips for table and matrix
Turn tooltips off for visuals
Slicer accessibility
Formatting pane improvements
Stepped line support for line and combo charts
Turn off combo chart data labels for individual series
Sorting experience improvement

Analytics
Distribution factor insights

Custom visuals
Power BI certified category
Disabling specific organizational visual
Visio custom visual generally available
Mapbox custom visual generally available
DataText Box custom visual
China Scatter Map custom visual

Data Connectivity
IBM DB2 DirectQuery connector (preview)
Improvements to Web By Example connector
Support for importing multiple custom tables
Automatic completions for specifying sample values
Exposure of attribute selectors in HTML.Table function
SAP HANA – Default values for variables in Variable Input experience


Download link & feature summary and  here.


Thursday, July 26, 2018

Sort and Filter efffectively in Power BI

Actually this is one of the new features in the June 5, 2018 update of Power BI. In the other posts 1 , 2 you can review enhancements to Donut and Pie charts.

Here in, the improvements in this update allows you to sort columns and filter them ver effectively.
I am using the data of from Indian Census from one of my earlier posts here .

This was imported into MS Excel and it was in turn imported into Power BI.
The data in Excel is shown here:


Sort_Filter_0
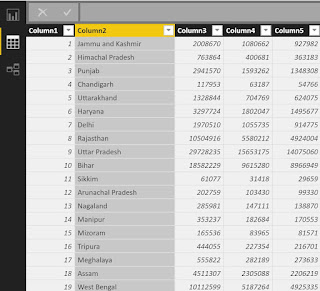
The data from this post is as shown in Power BI:


Sort_Filter_1

In the June 5, 2018 Power BI used here, you can sort and filter in each column.

Column 2 which is text (name of Indian State), you have the sort option come up when you
click the column2's handler as shown.


Sort_Filter_2

For Columns 3 to 5, you have other filtering options as well as sorting:


For example if you choose to filter in the state column(Column2). Here only states starting with 'A' are chosen.


When you agree for this filter by clicking OK, you would see this,


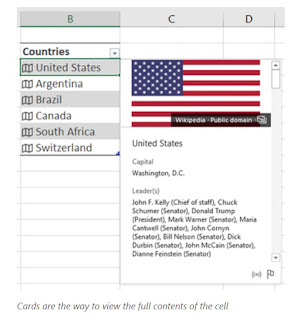
You now have Geography and Stock data types in MS Excel office 365


I think you must have specific versions of Office 365 for you to work with these new data types.

Microsoft is excited but I am not, as I may have to pay up for (or upgrade subscription) something I may only use to see what it can do.

The nice thing about these are they are AI Powered and they search things out of Microsoft Knowledge Graph, the service that powerss their search engine, Bing.

What it does is it has a context and the search is in this context.

These are shots of Excel sheet with the Geography data type from the above link.


Thursday, July 5, 2018

PowerShell Pro Tools is a Visual Studio Community 2017 extension that you can try free

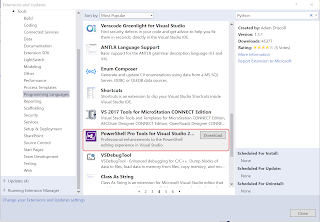
I see there is at least one extension, PowerShell Pro Tools that you can download.

You can find it in the Visual Studio Community 2017.


 You can get the installer to modify the Visual Studio IDE


You need to relaunch Visual Studio to see the next screen.  Just for trying it out you can give an email and get a temp license.


This is from GitHub site listing all that you can do with this.


This is the site info for this tool


I am not paying this invoice. I am disregarding it, becuase....

 I am not paying this invoice because MICROSOFT has not provided me with a satisfactory way to access my account since June of this year des...