Friday, December 30, 2016

Report based on a text file using Power BI

Power BI in its October release supports data access to many more data providers although accessing data from text files existed even from earlier versions.

In this post, I shall describe accessing data from a text files using the October release of Power BI.
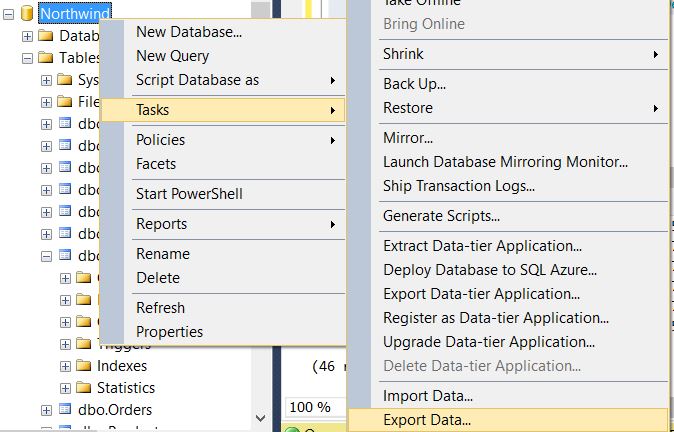
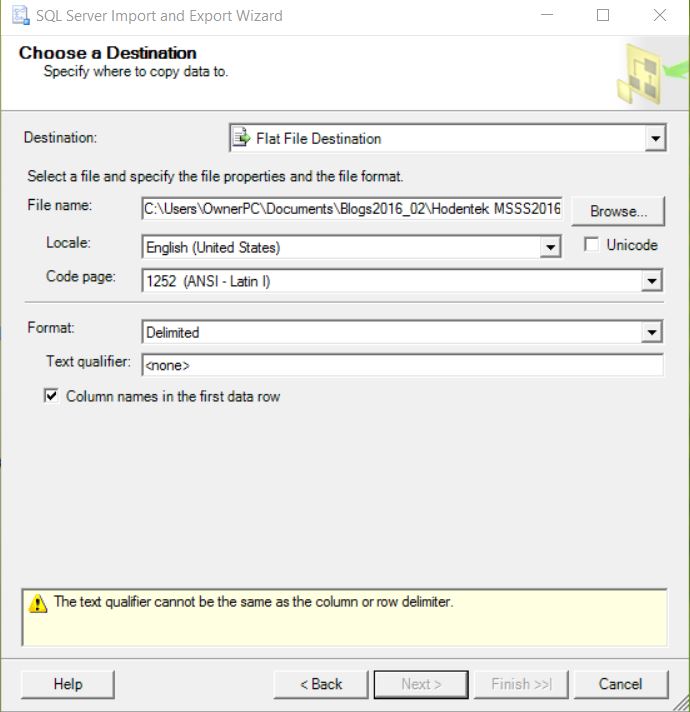
The text file was created using the Export-Import Wizard.

Launch Power BI Desktop from its shortcut. After the launch hit Get Data.
In the Get Data drop-down you will find all the sources.


Click on Text.
You may need to wait for sometime. After a wait you will see the text file(FFD.txt) in the Power Bi screen as shown.


PowerBI_text_02.png

Click Open to bring the data to Power BI UI.


Click Load to load the data to Power BI.

The data fields are loaded to the UI that you can see in the Home tab as shown.


PowerBI_text_03.PNG

Just click on Order Date. Order Date and Product Name check boxes under Fields and they get added to the Value fields and the designer as shown.


PowerBI_text_04.png
----------
Once the data is in creating a report is easy; just dragging and dropping the fields to create a report as shown. You could also create by editing the query by invoking the Query Editor.


PowerBI_text_05.png

That is all there is to it.👦

Thursday, December 29, 2016

Creating a CSV file from SQL Server 2012 Data

Often you may require exporting data from SQL Server to other locations with a different structure such as XML, JSON or CSV.

From the earliest versions of SQL Server, the Data Transformation Wizard was a part of the tools in converting data in the SQL Server tables to other formats.

Herein I describe how to transform data in the Northwind Database tables to a delimited text file using the wizard in a couple of easy steps.

In Step 1 you need to bring up the wizard. It is easy and you can do it from SQL Server Management Studio as shown in this figure below.


Step1_jpg

You click on Export Data... to invoke the wizard who will guide you through the process. Actually there is a welcome scree after which this screen is displayed. You need to choose a data source from which you want to export data. The program finds a server already installed and it also uses the default authentication, namely Windows Authentication. If you have followed SQL Server 2012 installation in my blog you would notice that this was the type of authentication configured at installation time. Using the Refresh screen the Northwind database is also chosen as the database chosen from which data will be exported.


Step11.jpg

Click Next brings up the next step in the wizard as shown. The Choose a Data Destination window is displayed. since we plan on exporting data into a delimited text format, create an empty file (herein FFD.txt) with extension text(CSV) and save it to a location of choice. For Destination choose Flat File Destination. Browse and locate the empty file you created. You may accept other defaults unless you want to change.


Step2.jpg

Click Next to get to the next step as shown. We will use a query to specify the data to be transformed.


Step4.jpg


Click Next. We need to provide a query to get the data from the database. Here is the query that is going to be used.
===========================================
SELECT Products.ProductName, [Order
Details].UnitPrice, [Order Details].Quantity, Orders.OrderDate, Orders.RequiredDate
FROM     [Order Details] INNER JOIN
                  Orders ON [Order Details].OrderID = Orders.OrderID INNER JOIN
                  Products ON [Order Details].ProductID = Products.ProductID
Where [Order Details].UnitPrice>100

===========================================
The next window needs a query to be processed.

Step5.jpg

Insert the previously shown query. You can hit the Parse button to verify that the query is good. You can also Browse and get the query from a saved file.

Click Next to display a screen to configure the destination as shown.


Step 7.png

Click Next. The summary screen is displayed as shown.

Step 8.png

You are almost done. Hit the Finish button. The program processes your request and comes up with success or failure. In this case success.

Step 9.png


You are done. You have successfully exported data to a delimited text format from SQL Server Tables.


Tuesday, December 6, 2016

Geospatial viewer in SQL Anywhere 17

Following globalization and opening of data centers all over the world, visualizing spatial data has become urgent and is supported by applications as well as databases.

SQL Anywhere 17 does have a spatial data viewer and you will have to invoke it in the Interactive. The procedure is as follows:

There is table called SpatialShapes in the 'demo' database which has several geometric shapes in each row of it's SpatialShapes table.

After connecting to the 'demo' database right click the SpatialShapes(GROUPO) table to reveal a drop-down list as shown.


SpatialGeom_00

In the above drop-down pick the first option, View data in Interactive SQL. The Interactive SQL windows appears as shown with a Select query.

SpatialGeom_01

Click Tools to display the drop-down list.

SpatialGeom_02

Click Spatial Viewer in the list to open the Spatial Viewer1 window as shown.


SpatialGeom_03

 Click Execute at the bottom of the above window to display the graphic view of the data which consists of a variety of geometrical shapes as shown.


SpatialGeom_04

Thursday, December 1, 2016

SQL Anywhere 17 Reports using Power BI

 Power BI is a great tool to turn out reports from many data sources. With OLE DB connector added in the October Update of Power BI it is quite easy to generate a report.

In this post I describe creating a report using data from the Financial Data (Group 0) of the sample database 'demo'

Step 1:
Connect to SQL Anywhere 17
Launch SQL Central and connect to Demo database

 Step 2:
Launch PowerBI and connect to SQL Anywhere 17 Demo database using a OLE DB connection. Make sure to use the Advanced button to run the query as shown.


SQLAny17_Repo_00.png
When you get the data in the Query Editor click Load.


SQLAny17_Repo_01.png
The Financial Data gets loaded as shown.


SQLAny17_Repo_02.png
Choose data fields as shown:


SQLAny17_Repo_03.png

Choose the visualization as shown.


SQLAny17_Repo_04.png

Drag Amount to Tooltips as shown.


SQLAny17_Repo_05.png

Now when you hover over the graph you get to see the tool tip. The repeated data is because Amount is both in Value and Tooltips fields.


SQLAny17_Repo_06.png

I am not paying this invoice. I am disregarding it, becuase....

 I am not paying this invoice because MICROSOFT has not provided me with a satisfactory way to access my account since June of this year des...