RESTful Services are much simpler than SOAP based services using WSDL. SQL Server Database can be exposed as a resource through a RESTful service and using RESTful API you can get data formatted in a standard way for different kinds of applications.
Some of the database examples that can be used for working with RESTful web services may be found here:
Northwind Service:
services.odata.org/northwind/northwind.svc
AdventureWorks Service:
http://www.odata.org/odata-services/ and AdventureWorks OData Service here,
http://blogs.msdn.com/b/derrick_vanarnams_blog/archive/2012/09/06/announcing-the-adventureworks-odata-feed-sample.aspx, or
http://services.odata.org/AdventureWorksV3/AdventureWorks.svc
You can easily connect to OData data feed from the above services using PowerBI as detailed here:
http://hodentekmsss.blogspot.com/2015/08/managing-relationships-in-power-bi.html
Once you are connected you can easily visualize data which is Page1 of the visualization as shown here:
.
 V_Odata01.png
Publishing the report:
You Publish this report to PowerBI.com site. Before publishing you may have to Save the changes you have made.

V_Odata02.png
In order to publish you need a Power BI account.

V_Odata03.png
For Microsoft Data Management Gateway read here:
http://www.microsoft.com/en-us/download/details.aspx?id=39717
Creating data visualization
The following describes a step-by-step procedure to create a visualization report such as the one you saw earlier.
Step 1: Click New Page in the ribbon to add a new page to your report.
The new page becomes Page 1 while the previous becomes Page 2
Step 2: Click ProductName under Fields. The ProductName Column gets added to the Page as shown. In Visualizations, ProductName (all) is added.

V_Odata04.png
Under Visualizations click on ProductName (all) under Visual Level Filters. This opens up all the product names as shown.

V_Odata05.png
You can filter the product name by choosing a couple of them (or as many as required for your report) as shown (here a dozen or so chosen).

V_Odata06.png
Step 3:
Click Order_Details under Fields and choose Quantity and Price (by placing check marks) as shown. These gets added to the visualization page.

V_Odata07.png
Step 4: Click on Clustered Column chart and the chart is created in the page as shown.

V_Odata08.png
Step 5: You can make changes to the chart by clicking on the Format icon right next to chart.

V_Odata09.png
Step6: For example you can make changes to the chart title by expanding the configurable items of the Title as shown.

V_Odata10.png
In Page 2 all the products were chosen and there was a vertical scrollbar to review a product and in the present page only few are chosen.
It is very easy to create visualizations and modify them quite easily.
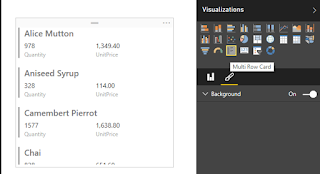
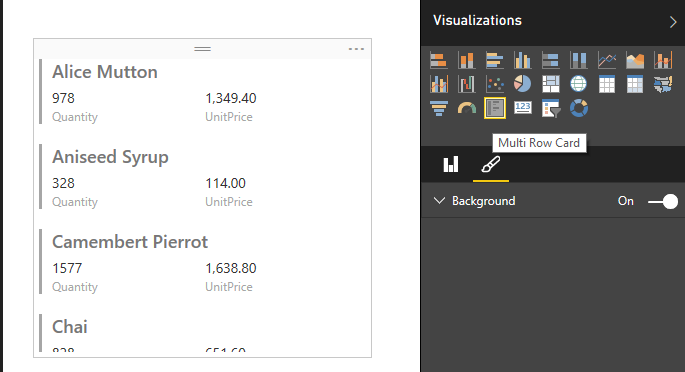
Step 7: Click on Multi-row card under visualizations and the page visualization changes accordingly as shown.
V_Odata10.png
Some of the database examples that can be used for working with RESTful web services may be found here:
Northwind Service:
services.odata.org/northwind/northwind.svc
AdventureWorks Service:
http://www.odata.org/odata-services/ and AdventureWorks OData Service here,
http://blogs.msdn.com/b/derrick_vanarnams_blog/archive/2012/09/06/announcing-the-adventureworks-odata-feed-sample.aspx, or
http://services.odata.org/AdventureWorksV3/AdventureWorks.svc
You can easily connect to OData data feed from the above services using PowerBI as detailed here:
http://hodentekmsss.blogspot.com/2015/08/managing-relationships-in-power-bi.html
Once you are connected you can easily visualize data which is Page1 of the visualization as shown here:
.

Publishing the report:
You Publish this report to PowerBI.com site. Before publishing you may have to Save the changes you have made.

V_Odata02.png
In order to publish you need a Power BI account.

V_Odata03.png
For Microsoft Data Management Gateway read here:
http://www.microsoft.com/en-us/download/details.aspx?id=39717
Creating data visualization
The following describes a step-by-step procedure to create a visualization report such as the one you saw earlier.
Step 1: Click New Page in the ribbon to add a new page to your report.
The new page becomes Page 1 while the previous becomes Page 2
Step 2: Click ProductName under Fields. The ProductName Column gets added to the Page as shown. In Visualizations, ProductName (all) is added.

V_Odata04.png
Under Visualizations click on ProductName (all) under Visual Level Filters. This opens up all the product names as shown.

V_Odata05.png
You can filter the product name by choosing a couple of them (or as many as required for your report) as shown (here a dozen or so chosen).

V_Odata06.png
Step 3:
Click Order_Details under Fields and choose Quantity and Price (by placing check marks) as shown. These gets added to the visualization page.

V_Odata07.png
Step 4: Click on Clustered Column chart and the chart is created in the page as shown.

V_Odata08.png
Step 5: You can make changes to the chart by clicking on the Format icon right next to chart.

V_Odata09.png
Step6: For example you can make changes to the chart title by expanding the configurable items of the Title as shown.
V_Odata10.png
In Page 2 all the products were chosen and there was a vertical scrollbar to review a product and in the present page only few are chosen.
It is very easy to create visualizations and modify them quite easily.
Step 7: Click on Multi-row card under visualizations and the page visualization changes accordingly as shown.
V_Odata10.png


Thank you for sharing the post its really knowledgeable.
ReplyDeleteTop Digital Marketing Services
SEO Services
Digital Marketing Services
How to install WordPress