Most of the SQL Servers have an integrated Reporting Services, a stable work horse for not only turning out reports but also handling all aspects of enterprise reporting from getting data to distributing, monitoring, etc. It has a reporting services Report Server and an integrated Report Manager front end.
I have covered the Reporting Services in two of my more popular books, one for SQL Server 2008 and another for Reporting Services 2012. The latter covers both the Native Mode of the server but also the SharePoint Integrated mode.
PowerBI on the other hand is supposed to provide the ad-hoc authoring of reports even though the author of the report has the knowledge of neither the complete innards of the report data nor the programming capabilities of a full-blown report developer.
In this post, I will step through the process of connecting to SQL Server 2016 from one of the recent versions of Power BI. I have a number of posts for the interested reader related to Power BI at the conclusion of this post.
The details of this post relates to a Windows 10 laptop which has a local named instance of SQL Server 2016 (Developer edition) and Power BI.
Step 1:
Launch POWER BI from its desktop shortcut.
 PowerBI_00
Step 2:
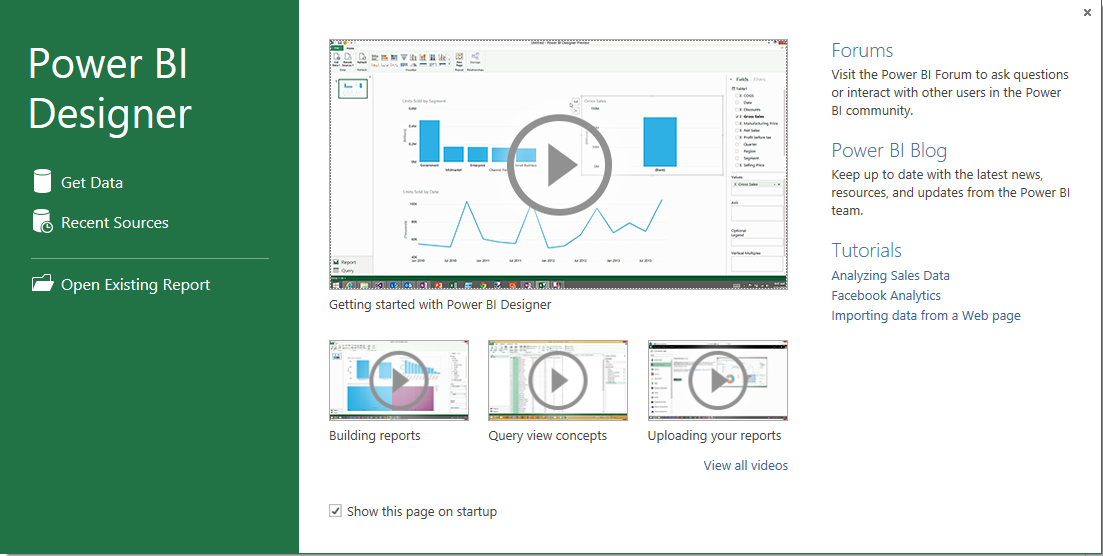
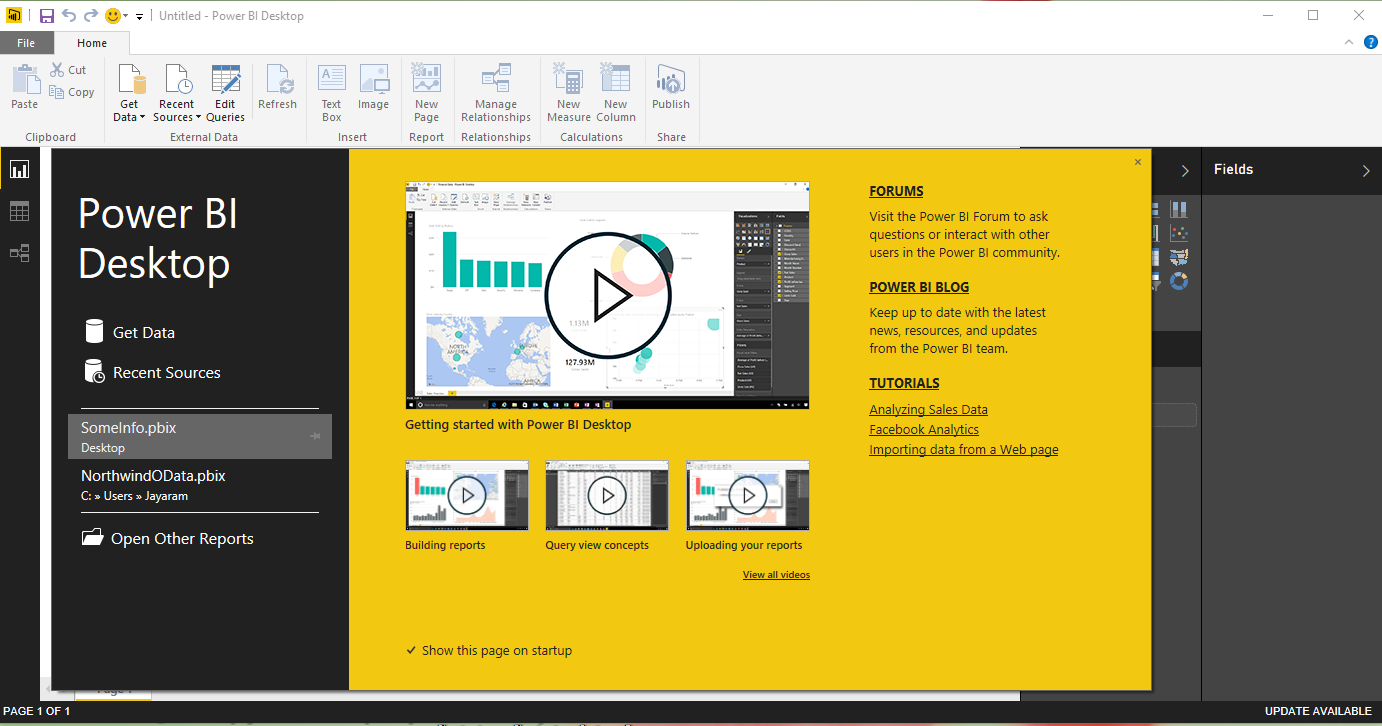
Make sure your SQL Server 2016 is up and running. Get to the main screen where you will be designing by dismissing the modal splash screen.
 PowerBI_01
Click on GetData. You should get a drop-down menu with various data sources listed. When you hover over SQL Server you can see the pop-up as shown.
 PowerBI_02
Click on SQL Server to display the following:

PowerBI_03
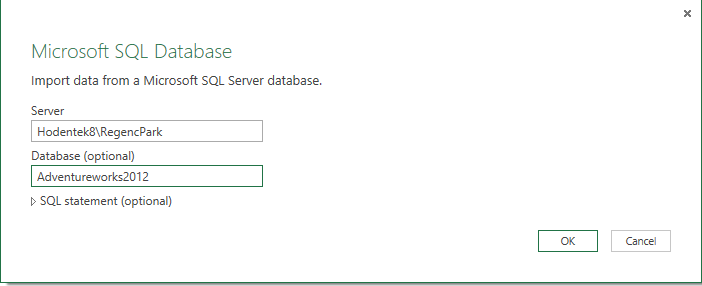
You need to enter the details. The present version is not showing any options to browse for a server. You need to enter (You can get the information from the SSMS 2016) the details, the one shown are for the present named Instance of SQL Server 2016.

Click OK and you will be displaying the following screen:

PowerBI_05
SQL Server 2016 was installed for Windows Authentication access and therefore you can accept the default and click Connect.
You get this message related to encryption. SQL Server 2016 supports encryption and I am not sure why this message generated.

PowerBI_06
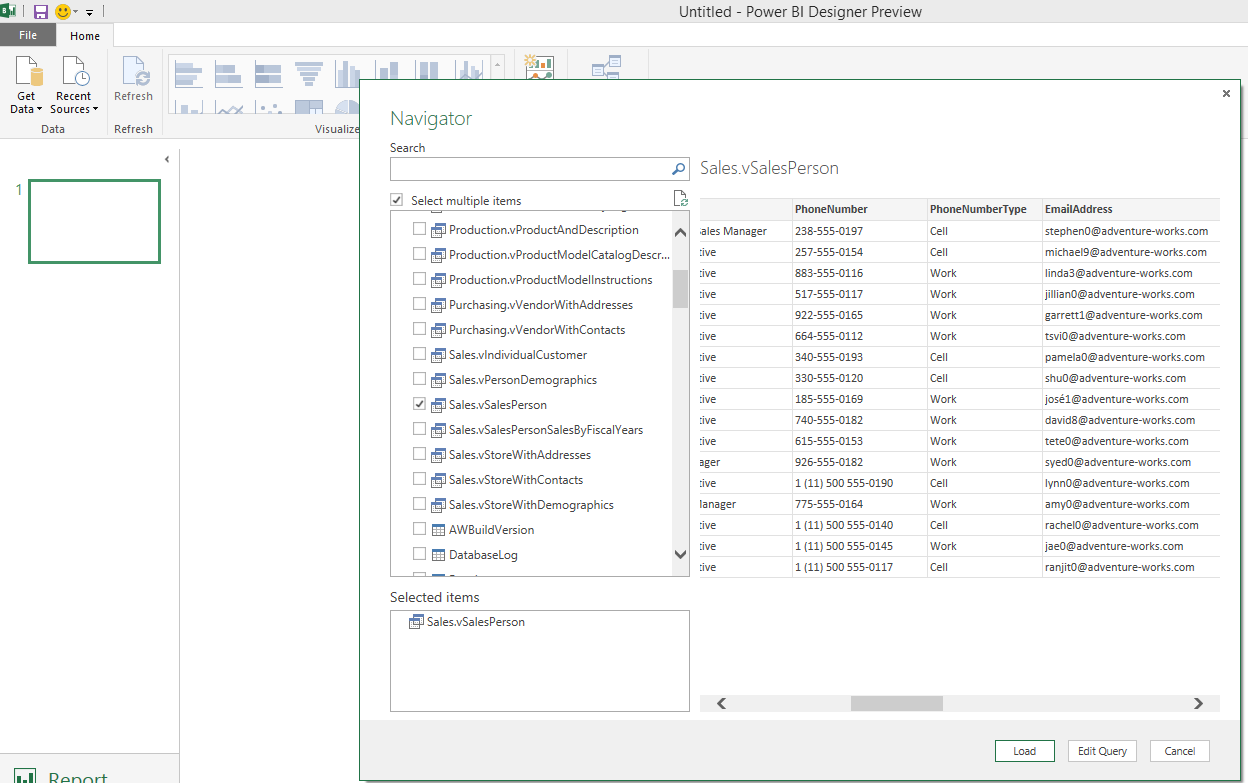
Click OK and you are connected to the AdventureWorks2014 Database as shown.
 PowerBI_07
You may want to read up on the following related stuff to get a head start with Power BI:
PowerBI and the Cloud
http://hodentek.blogspot.com/2015/08/doing-bi-in-cloud-using-powerbi-for.html
PowerBI on Gartner's Magic Quadrant
http://hodentek.blogspot.com/2015/07/qlik-is-in-gartners-bi-magic-quadrant.html
Report from SQL Anywhere 16 using Microsoft Power BI
http://hodentek.blogspot.com/2015/02/powerbi-preview-reporting-from-sql.html
Report from an EXCEL application
http://hodentek.blogspot.com/2015/02/powerbi-preview-reports-using-data-on.html
Rapid reporting with Microsoft Power BI
http://hodentek.blogspot.com/2015/02/spin-out-cutting-edge-report-with-power.html
Microsoft Intelligent System Services
http://hodentek.blogspot.com/2015/03/microsoft-azure-iot-services-update.html
Power BI Unchained
http://hodentek.blogspot.com/2015/02/power-bi-unchained.html
I have covered the Reporting Services in two of my more popular books, one for SQL Server 2008 and another for Reporting Services 2012. The latter covers both the Native Mode of the server but also the SharePoint Integrated mode.
PowerBI on the other hand is supposed to provide the ad-hoc authoring of reports even though the author of the report has the knowledge of neither the complete innards of the report data nor the programming capabilities of a full-blown report developer.
In this post, I will step through the process of connecting to SQL Server 2016 from one of the recent versions of Power BI. I have a number of posts for the interested reader related to Power BI at the conclusion of this post.
The details of this post relates to a Windows 10 laptop which has a local named instance of SQL Server 2016 (Developer edition) and Power BI.
Step 1:
Launch POWER BI from its desktop shortcut.
Step 2:
Make sure your SQL Server 2016 is up and running. Get to the main screen where you will be designing by dismissing the modal splash screen.

Click on GetData. You should get a drop-down menu with various data sources listed. When you hover over SQL Server you can see the pop-up as shown.

Click on SQL Server to display the following:

PowerBI_03
You need to enter the details. The present version is not showing any options to browse for a server. You need to enter (You can get the information from the SSMS 2016) the details, the one shown are for the present named Instance of SQL Server 2016.

PowerBI_04
Click OK and you will be displaying the following screen:

PowerBI_05
SQL Server 2016 was installed for Windows Authentication access and therefore you can accept the default and click Connect.
You get this message related to encryption. SQL Server 2016 supports encryption and I am not sure why this message generated.

PowerBI_06
Click OK and you are connected to the AdventureWorks2014 Database as shown.

You may want to read up on the following related stuff to get a head start with Power BI:
PowerBI and the Cloud
http://hodentek.blogspot.com/2015/08/doing-bi-in-cloud-using-powerbi-for.html
PowerBI on Gartner's Magic Quadrant
http://hodentek.blogspot.com/2015/07/qlik-is-in-gartners-bi-magic-quadrant.html
Report from SQL Anywhere 16 using Microsoft Power BI
http://hodentek.blogspot.com/2015/02/powerbi-preview-reporting-from-sql.html
Report from an EXCEL application
http://hodentek.blogspot.com/2015/02/powerbi-preview-reports-using-data-on.html
Rapid reporting with Microsoft Power BI
http://hodentek.blogspot.com/2015/02/spin-out-cutting-edge-report-with-power.html
Microsoft Intelligent System Services
http://hodentek.blogspot.com/2015/03/microsoft-azure-iot-services-update.html
Power BI Unchained
http://hodentek.blogspot.com/2015/02/power-bi-unchained.html