Excel provides excellent, easy-to-use MAP element that can be inserted into an Excel spreadsheet. It is easily accessed from the Insert menu item as shown. Of course your data must have geographical data.
Let us get some data into a work sheet. Click create Data and use the option to get from the Web. Let us use some data from Wikipedia which in turn shows data from Indian census. Let us use the Basic option.
Click OK.
You will get the next window that you are accessing the web content anonymously.
Click Connect. The connector starts connecting to the Demographics_of_India source.
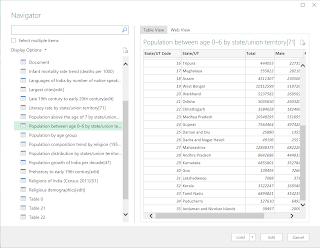
When the connection succeeds you can access a bunch of data that comes into the Navigator pane of a pop-up window as shown.
There is a wealth of data to be analyzed in the Navigator. We just choose the one shown, ‘Population between age 0-6 by state/union territory. This displays the data in the Table View pane as shown above.
Click Load to load the data into your Excel application in Sheet 1 as shown.
Note that it has already added the Min and Max values of the data. Clicking any particular map region shows the data for that region.
Now you can pretty up the map with all sorts of details using the Chart Elements.
Don't you think that was easy as 1-2-3?
Let us get some data into a work sheet. Click create Data and use the option to get from the Web. Let us use some data from Wikipedia which in turn shows data from Indian census. Let us use the Basic option.
Click OK.
You will get the next window that you are accessing the web content anonymously.
Click Connect. The connector starts connecting to the Demographics_of_India source.
When the connection succeeds you can access a bunch of data that comes into the Navigator pane of a pop-up window as shown.
There is a wealth of data to be analyzed in the Navigator. We just choose the one shown, ‘Population between age 0-6 by state/union territory. This displays the data in the Table View pane as shown above.
Click Load to load the data into your Excel application in Sheet 1 as shown.
Excel has this nice feature of displaying the Recommended charts as you begin to insert a chart. It
also shows how to do it as shown next. When you choose the whole data and try to bring
in a Map, you will sent to BING (map provider) because BING has the right map to
provide and of course you need to accept their terms. When you accept,
Map of the World comes up which now focuses on India as shown in the
next window.
Note that it has already added the Min and Max values of the data. Clicking any particular map region shows the data for that region.
Now you can pretty up the map with all sorts of details using the Chart Elements.
Don't you think that was easy as 1-2-3?


No comments:
Post a Comment