It is relatively easy to create reports using the SQL Server Mobile Report Publisher. You can source your data from two kinds of data sources, all though more sources may be added in future versions:
Excel.xlsx files
Reporting Services Web Portal
In this post I will be considering getting data from an Excel file.
If you have used Power BI before, it is even more easier as the UI follows some of the same ideas.
In order to follow this you must install the SQL Server Mobile Report Publisher (SSMRP). You may follow these earlier posts 1, 2 to install SSMRP.
Kindly follow the screen shots that steps you through the procedure to create a simple report.
You launch the SSMRP from its shortcut in All programs.
By default it opens displaying the Layout tabbed page.

The toolbar has Layout, Data, Settings and Preview. I have parked it in Data that is what I am going to do first.


This time around I will be using data from an Excel file. I will be using the same file I used in several of my recent posts 1, 2, 3. However, I opened the .csv file in Excel and saved it as a file with the .xslx extension. You start browsing for the file in your hard disk.
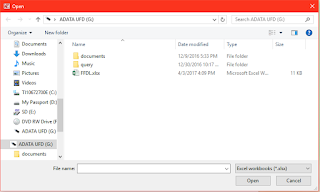
FFDL.xslx is the file that is found while browsing.


This sample data is from Northwind database on my SQL Server.
Click on the Settings icon on the FFDL file at the bottom if you need to remove/export etc. as shown.

Now click on Layout and you get a number of rectangles on the right onto which you can bring a chart from a variety of charts under Layout. You can reduce the columns or rows of rectangles using the vertical and horizontal scroll controls at the top

Herein, I just dragged and dropped a bar chart on to one of the rectangles.


After changing to Avg click on Preview. Click on the small icon for report to zoom it up to full window.


I apologize for not getting it all done in one go (it took me 4 or 5 attempts to post this). I have a serious browser problem that I have not been able to address yet. Review here for my browser problems.
Excel.xlsx files
Reporting Services Web Portal
In this post I will be considering getting data from an Excel file.
If you have used Power BI before, it is even more easier as the UI follows some of the same ideas.
In order to follow this you must install the SQL Server Mobile Report Publisher (SSMRP). You may follow these earlier posts 1, 2 to install SSMRP.
Kindly follow the screen shots that steps you through the procedure to create a simple report.
You launch the SSMRP from its shortcut in All programs.
By default it opens displaying the Layout tabbed page.

The toolbar has Layout, Data, Settings and Preview. I have parked it in Data that is what I am going to do first.
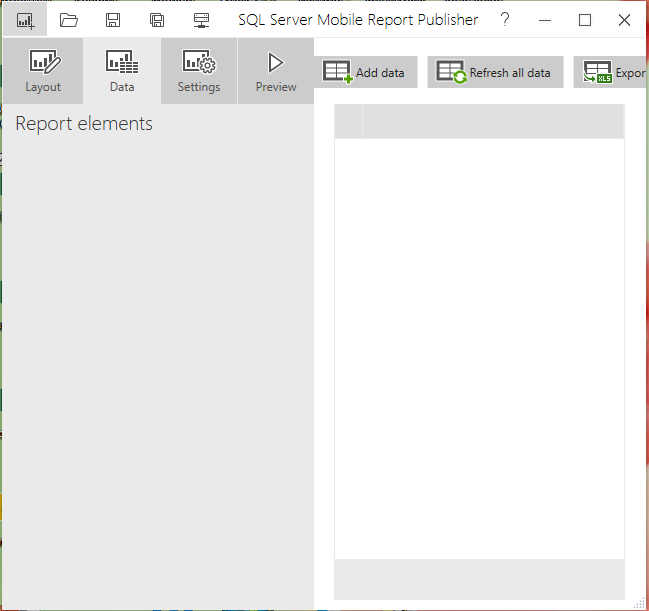
Click on Add data to get some data into the UI. You have two options, Excel and Report Server.

This time around I will be using data from an Excel file. I will be using the same file I used in several of my recent posts 1, 2, 3. However, I opened the .csv file in Excel and saved it as a file with the .xslx extension. You start browsing for the file in your hard disk.

FFDL.xslx is the file that is found while browsing.

Click Import at the bottom of the UI after placing a check mark for the FFDL file a shown above to bring data in as shown.

This sample data is from Northwind database on my SQL Server.
Click on the Settings icon on the FFDL file at the bottom if you need to remove/export etc. as shown.

Now click on Layout and you get a number of rectangles on the right onto which you can bring a chart from a variety of charts under Layout. You can reduce the columns or rows of rectangles using the vertical and horizontal scroll controls at the top

Herein, I just dragged and dropped a bar chart on to one of the rectangles.

When you click on this chart it enlarges as shown.

Obviously this chart does not reflect our data as the year axis is all wrong.
Go back by clicking on the back arrow at the top which will take you back to Layout. Now click on Data.

As you can see the chart at present is relevant to a Simulated table. Click on the handle for Main Series to display the following:

Click on FFDL. You should be seeing this displayed.


You can change quite a lot of other things, like adding category; adding a report title and some of these can be done in the Settings and some in the Layout items.
When you target a smaller foot print device using the dropdown in Layout shown here:

You will see the following:

Oops! That did not work. I wonder what the problem is. I went back to Master and it is still OK. Next I try changing to Tablet and the data does not show. Something is broken! Is it possible that the last nights OS update did this? I wonder.


No comments:
Post a Comment